Fit 3D In Corpus Christi
What is Fit 3D?
Fit 3D body scanners use advanced imaging technology, such as structured light scanning or photogrammetry, to capture detailed information about the body. This information is then used to create a 3D model that can be used for various purposes, such as custom clothing design, fitness tracking, medical assessments, and virtual try-ons.
In the fitness industry, Fit 3D technology is often used by gym and fitness centers to track clients’ progress and measure body composition. The 3D models can provide accurate measurements of body fat percentage, muscle mass, and other metrics, which can help trainers and clients set realistic goals and track their progress over time.
How does Fit 3D work in Corpus Christi?
Fit 3D technology works by using specialized cameras and software to capture and analyze the shape and measurements of the human body in three dimensions.
The process typically involves the following steps:
- The person being scanned stands in a designated area, usually in front of a Fit 3D scanner or inside a designated booth.
- The scanner uses various imaging techniques, such as structured light scanning or photogrammetry, to capture multiple images of the person’s body from different angles.
- The images are then combined and processed by the software to create a 3D model of the person’s body shape and measurements.
- The 3D model can be viewed and analyzed in detail by fitness trainers, clothing designers, medical professionals, and other users, depending on the intended application.
Fit 3D technology is known for its accuracy and ability to provide detailed body measurements that can be used for a variety of purposes, such as tracking fitness progress, designing custom clothing, and conducting medical assessments.

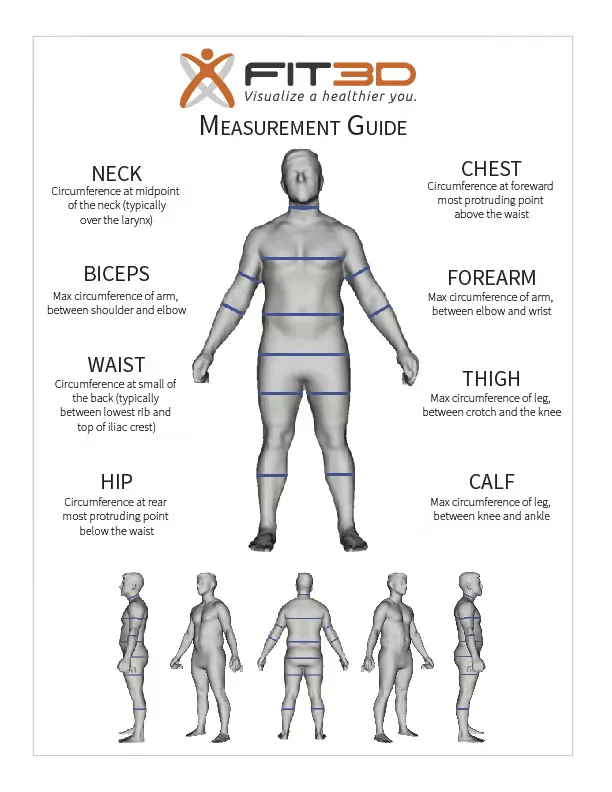
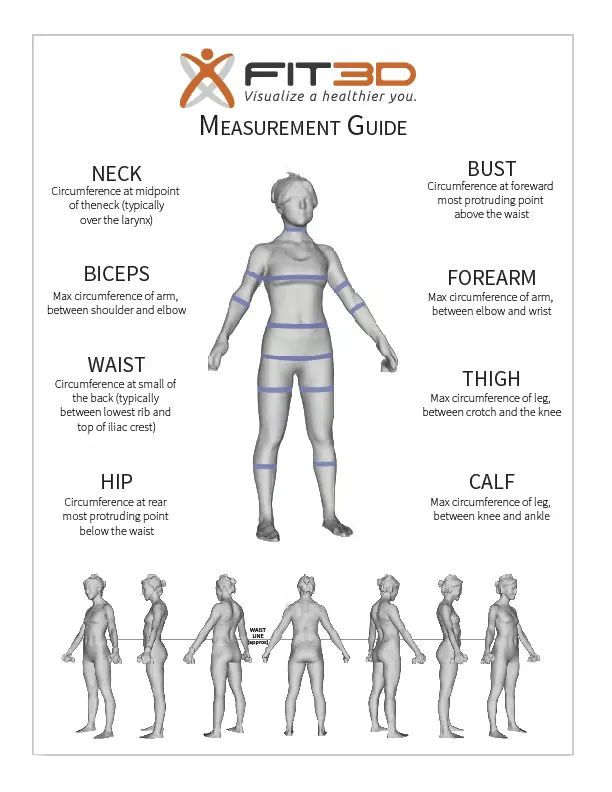
Body Shape
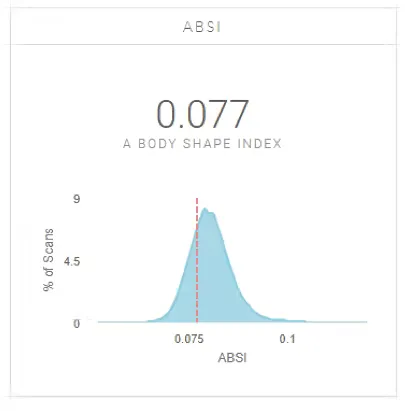
A BODY SHAPE INDEX (ABSI)
Description: A Body Shape Index (ABSI) is a simple way to evaluate total body shape as it is associated with early all-cause mortality. Researchers recognize that obesity is considered the leading cause of premature death worldwide. ABSI is a factor of roundness of the waist and is associated with BMI and height.
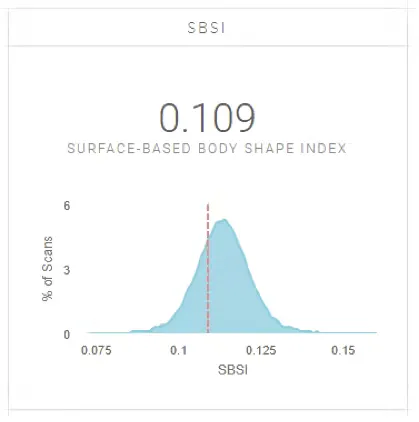
SURFACE-BASED BODY SHAPE INDEX (SBSI)
Description: The lower your Surface-based Body Shape Index (SBSI) is, the less likely you are to suffer early all-cause mortality. The main purpose of this index is to estimate the amount of weight in your torso compared to amount of weight in the rest of your body. This index associates well with your overall risk of early mortality.
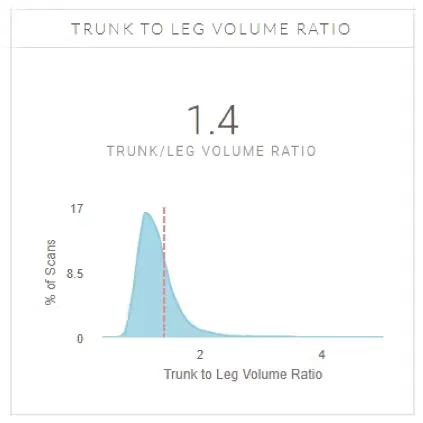
TRUNK TO LEG VOLUME RATIO
Description: Trunk to Leg Volume Ratio looks at the volume of your torso as compared with the volume of your legs. A high ratio of trunk to leg volume showed a strong association to diabetes and mortality that was independent of total and regional fat distributions. This novel body shape measure provides additional information regarding central adiposity and appendicular wasting to better stratify individuals at risk for diabetes and mortality, even among those with normal BMI.
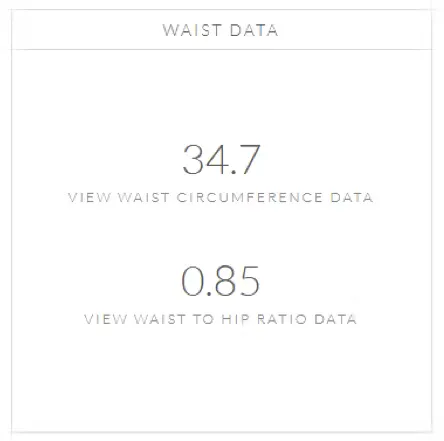
WAIST CIRCUMFERENCE DATA
Description: Waist circumference (WC) provides an independent prediction of risk over and above that of BMI. WC is particularly useful for patients who are categorized as normal or overweight on the BMI scale as a measurement associated with visceral fat and overall body shape. High risk is associated from WC alone where WC of men is > 102cm and where WC of women is > 88 cm. WC is the circumference measurement taken at the small of the back.
WAIST TO HIP RATIO DATA
Description: The waist to hip (WHR) ratio is obtained from dividing the circumference of the waist (the narrowest point between the hips and ribs) by the circumference of the hips (the widest part of the hips). WHR is a ratio generally used to evaluate whether the individual is at high risk of obesity, diabetes, coronary heart disease, and/or high blood pressure. The measurement evaluates body shape in the midsection of the body. This ratio as a health metric is extremely limited, but it is an easy way to try to evaluate the level of visceral fat one may have.
Body Composition
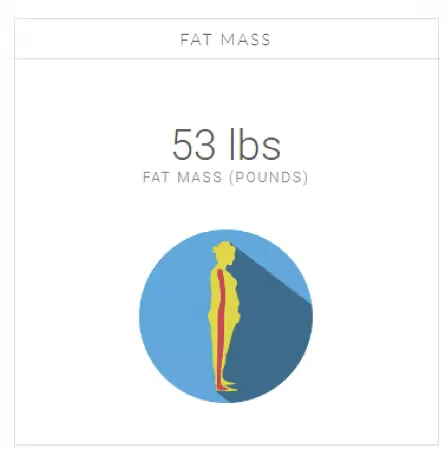
FAT MASS
Description: Fat mass is the adipose tissue within a body. This loose connective tissue is primarily composed of adipocytes (fat cells). Its main role is to store energy in the form of lipids. It also cushions and insulates the body.
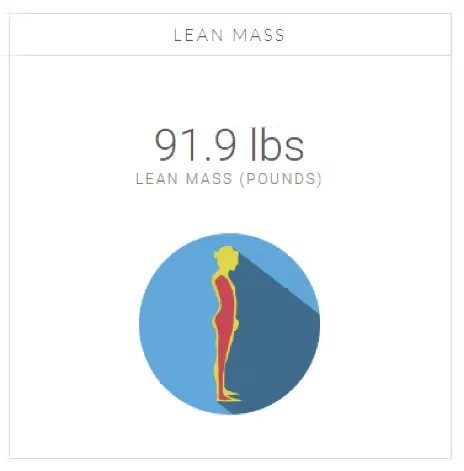
LEAN MASS
Description: The 2-component model, which consists of fat mass and lean mass calculations, is widely used to determine body composition. Fat mass is the mass of the adipose tissue in the body. Lean mass is the muscle tissue, skeletal tissue, and water in the body. In 3- and 4-component models, skeletal tissue and water are drawn out as isolated measurements.
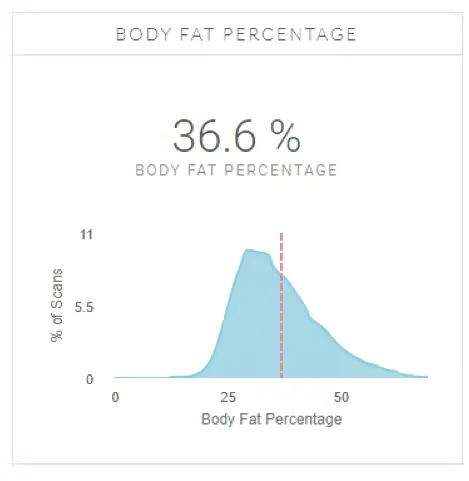
BODY FAT PERCENTAGE
Description: Body fat percentage (BFP) of a human is the total mass of fat divided by total body mass; body fat includes essential body fat and storage body fat. Essential body fat is necessary to maintain life and reproductive functions. The percentage of essential body fat for women is greater than that for men, due to the demands of childbearing and other hormonal functions. The percentage of essential fat is 2–5% in men, and 10–13% in women (referenced through NASM). BFP is used as a level of fitness since and is generally thought of as the replacement for BMI as BMI is a useful indicator of overall fitness for a large group of people, but a poor tool for determining the health of an individual.
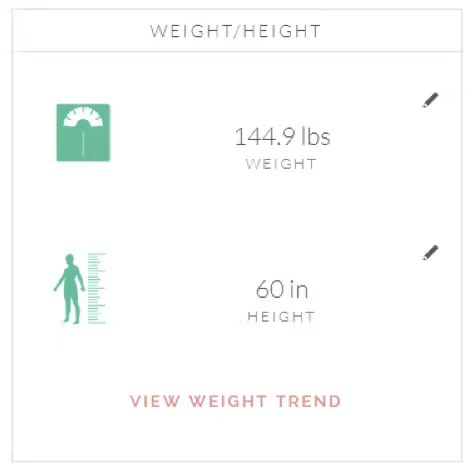
WEIGHT/HEIGHT
Description: Body weight is a person’s mass or weight. This is probably the easiest metric to measure on a human and is therefore a part of our primary assessment metrics; however, the body shape makeup and body composition is a much more real mechanism to determine the health of an individual.
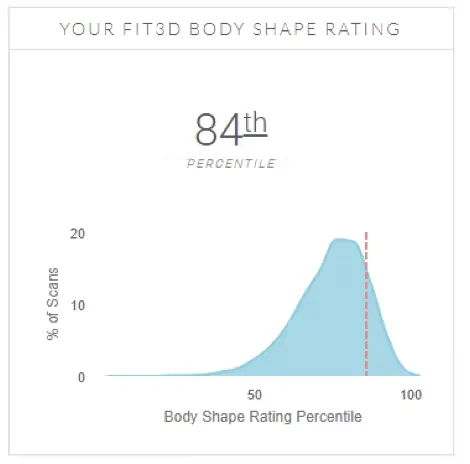
YOUR FIT3D BODY SHAPE RATING
Description: Fit3D extracted SBSI, ABSI, BMI, and Trunk to Leg Volume Ratio from more than 26,000 scans. Fit3D then evaluated the correlation between each algorithm and calculated weights for the health risk outcomes from the overall scan population. This results in a Body Shape Rating. Fit3D then normalized the score so that results are shown to the user as a percentile from 0 – 100.


